If I Can't Replay an Agent Run, I Don't Ship the Agent
· Bilal Tahseen
The worst agent bug report I get is a screenshot. A user says the agent "did something weird" on Tuesday. The dashboard shows the run succeeded: HTTP 200, latency normal, cost normal. The logs show a prompt was sent and a completion came back. None of that tells me which tool returned what, which retrieved chunk the model leaned on, which prompt version was live, or what the planner decided between step three and step four.
So I end up doing the thing everyone does. I paste the user's message into a playground, get a different answer, shrug, and tweak the prompt. That is not debugging. That is guessing with a nicer UI.
This post is about the fix: I don't ship a production agent unless I can replay any run, step by step, with the exact inputs it saw. Tool contracts keep calls well-formed. Shadow mode keeps writes from landing blind. A golden-set eval gate keeps a bad build off production. A budget cap and kill switch keeps a good build from spending like a bad one. Replayable traces are how you find out what actually went wrong when all of that still wasn't enough.
This is not a drop-in package. The sketches below are the shape of what I build. Your trace store, redaction policy, and agent framework will differ. If you copy the types into production and skip the hard parts — redaction, versioning, deterministic stubs — you get a very expensive log file.
Why logs and dashboards aren't observability for agents
A web request is mostly deterministic. Same input, same code, same output. You can reproduce a bug from the request body and a stack trace.
An agent run is not. Its behavior depends on:
- The prompt template version, not just the template
- The model id and provider-side model snapshot
- Sampling parameters (temperature, top-p, seed if the provider honors it)
- Every tool output, which came from a live system that has since changed
- Every retrieval result, from an index that has since been re-embedded
- The planner's intermediate decisions, which are themselves model outputs
- Conversation memory, which may have been summarized or truncated
Request logs capture maybe two of those. APM dashboards capture none. "LLM observability" tools that only record the final prompt and completion capture the last mile and lose the path. When an agent fails on step six because a tool returned a stale record on step two, the final prompt looks fine. The bug lives in the middle.
What I want is closer to a flight recorder: enough recorded state that I can re-run the exact decision sequence offline and see where it diverged from what I expected.
The architecture: record once, debug forever
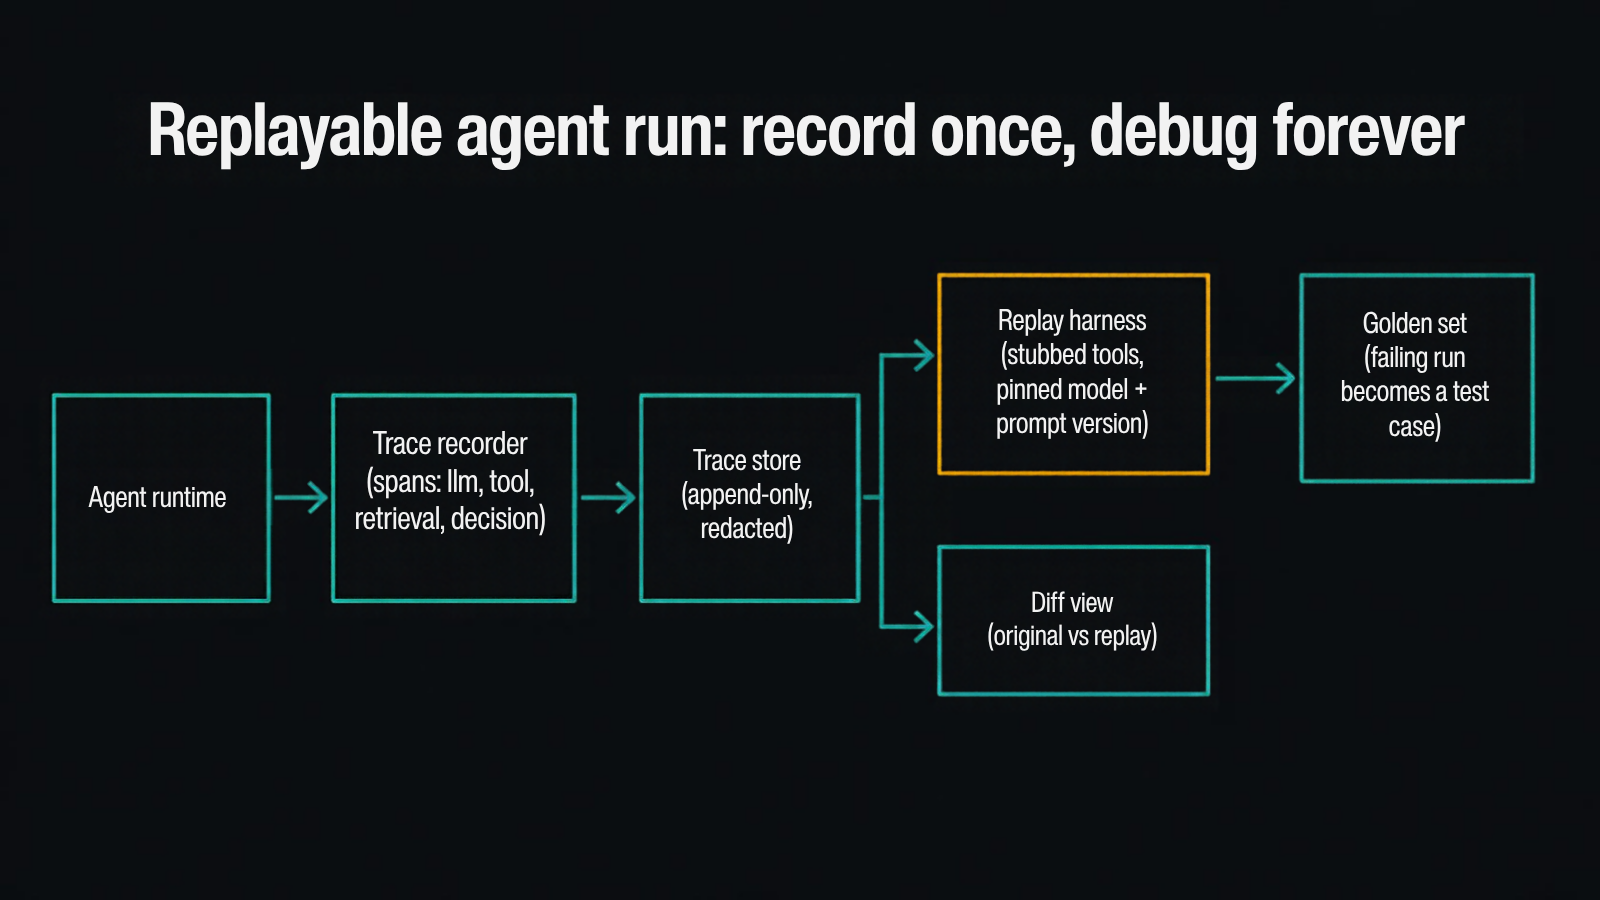
Agent runtime. Your LangGraph graph, your hand-rolled loop, whatever. It does not log directly. It emits spans through one interface so nothing bypasses the recorder.
Trace recorder. Wraps every boundary the agent crosses: LLM calls, tool calls, retrieval, and planner decisions. One run is a tree of spans with a shared run_id. I align span names and attributes with the OpenTelemetry GenAI semantic conventions where they exist, so I'm not locked into one vendor's tracing UI, and add my own attributes where they don't.
Trace store. Append-only. Redacted before write, not after. Retention is separate from the ops log because payloads are heavier and more sensitive than metrics.
Replay harness. Loads a recorded run, pins the model, prompt version, and parameters, and swaps every tool and retriever for a stub that returns the recorded output. Then it re-executes the agent and records a new trace.
Diff view. Original trace vs replay trace, span by span. The first span where they diverge is usually the bug, or the first place your system is nondeterministic in a way you didn't know about.
Golden set. Any run that turned out to be a real failure gets promoted into a test case, with its recorded tool outputs as fixtures. The next build has to pass it. That closes the loop back to the eval gate.
The trace schema I actually require
The schema matters more than the vendor. I've seen teams adopt a polished tracing product and still be unable to replay anything because they never recorded tool outputs, or recorded them truncated to 1,000 characters.
Every span gets:
run_id,span_id,parent_span_id,tenant_id,agent_idkind:llm|tool|retrieval|decision|memorystarted_at,ended_at,status,error_classcode_version(git SHA of the agent service)input_refandoutput_ref: pointers to redacted payload blobs, not inline blobs
LLM spans add:
model,provider,prompt_template_id,prompt_versionparams: temperature, top-p, max tokens, seed, tool-choice modemessages_ref: the fully rendered messages actually sent, after templating and memory injectiontool_schemas_hash: hash of the tool definitions the model saw on that turnusage: input, output, cached tokens
Tool spans add:
tool_name,tool_version,args_canonical_hashcontract_decision: what the contract layer did (admit, reject, coerce)mode: live or shadow- the full redacted output, because that's what the stub will return on replay
Retrieval spans add:
index_name,index_version(embedding model + build id)query,top_k, filters- returned chunk ids, scores, and the redacted chunk text
Decision spans add whatever your planner decides between model calls: next node in the graph, router branch, retry vs give up, escalate to human. If a decision isn't recorded, replay can't tell you whether the model chose it or your code did.
The rendered messages are the part people skip, and the part I care about most. A prompt template plus variables is not the same as what was sent. Memory summarization, truncation, and tool-result injection all happen between the template and the wire. Record the wire.
Redaction before write, not after
A trace store that holds raw user text, tool payloads, and retrieved documents is a second production database full of PII. Treat it like one.
The order I use:
- Classify at the boundary. Every tool declares which output fields are sensitive in its contract. Retrieval chunks inherit the classification of their source document.
- Redact or tokenize before the span is written. Emails, phone numbers, account numbers, and free-text fields from regulated sources get replaced with stable tokens (
<EMAIL_7f3a>), so the same value maps to the same token across the run and replay still behaves consistently. - Keep the vault separate. If a support engineer genuinely needs the raw value to debug, it lives in a separate store with access logging and a much shorter retention window.
- Never trace secrets. API keys, auth headers, and signed URLs are stripped at the HTTP client layer, not at the span layer, because by the span layer someone has already serialized them.
If you redact after write — a nightly job that scrubs the store — you have a window where every trace is raw, and every backup taken in that window is raw forever.
The replay harness
Replay has one job: re-execute the agent's decision path with the world frozen at the moment of the original run.
That means:
- Pin the model and parameters. Same model id, same temperature, same seed if supported. If the provider has since retired that model snapshot, the replay must say so loudly instead of silently using the alias.
- Pin the prompt version. Load the template by
prompt_version, not "latest". - Stub every tool. Match calls by
tool_name+args_canonical_hash. Return the recorded output. If the replayed agent makes a call that wasn't in the original trace, that's a divergence — record it and return a typedUnrecordedCallerror instead of hitting the live system. - Stub retrieval. Return the recorded chunks for the recorded query. If the query differs, that's a divergence too.
- Never touch live writes. The harness runs in a sandbox with no network route to production systems. Not "configured not to." No route.
type SpanKind = 'llm' | 'tool' | 'retrieval' | 'decision' | 'memory';

interface RecordedSpan {
  runId: string;
  spanId: string;
  parentSpanId: string | null;
  kind: SpanKind;
  name: string;
  inputRef: string;
  outputRef: string;
  attrs: Record<string, string | number | boolean>;
}

interface RecordedRun {
  runId: string;
  codeVersion: string;
  promptVersions: Record<string, string>;
  spans: RecordedSpan[];
}

type Divergence =
  | { type: 'unrecorded_call'; tool: string; argsHash: string; atSpan: string }
  | { type: 'output_mismatch'; spanId: string; field: string }
  | { type: 'decision_mismatch'; spanId: string; original: string; replay: string }
  | { type: 'model_unavailable'; model: string };

class RecordedToolStub {
  private readonly byKey = new Map<string, string>();

  constructor(run: RecordedRun, private readonly blobs: BlobStore) {
    for (const span of run.spans) {
      if (span.kind !== 'tool') continue;
      const key = `${span.name}:${span.attrs['args_canonical_hash']}`;
      this.byKey.set(key, span.outputRef);
    }
  }

  async call(tool: string, argsHash: string): Promise<unknown> {
    const ref = this.byKey.get(`${tool}:${argsHash}`);
    if (!ref) {
      // Never fall through to the live tool. A miss is the finding.
      throw new UnrecordedCall(tool, argsHash);
    }
    return this.blobs.load(ref);
  }
}
The class above is the easy 10%. The real system is canonical argument hashing that's stable across code versions, a blob store with redaction already applied, a way to load historical prompt versions and tool schemas, and a runner that can execute the agent graph with injected stubs. Most frameworks don't make that last one easy. You end up designing the agent around injectable boundaries from day one, which is the actual point: an agent that can't be replayed was usually built with tools and clients hard-wired into the loop.
Replay is not deterministic, and that's useful
Even with a pinned model, temperature 0, and a seed, hosted LLMs are not guaranteed bit-for-bit reproducible. Batching, hardware, and provider-side changes can shift outputs. I don't pretend otherwise.
So replay gives me two modes:
- Frozen replay. Re-use the recorded LLM outputs too. Nothing calls a model. This reproduces the exact original path and lets me inspect every intermediate state, including the decisions my code made on top of model output. It's how I answer "what did the agent see at step four?"
- Live-model replay. Recorded tools and retrieval, but a real model call at each LLM span. Run it several times. If the bad behavior shows up most of the time, it's a model/prompt problem I can fix and test against. If it shows up rarely, it's a variance problem — and the fix is often structural (tighter tool contracts, a validator, a narrower decision), not another sentence in the prompt.
The diff view makes both readable: original span, replay span, first divergence highlighted.
The triage loop
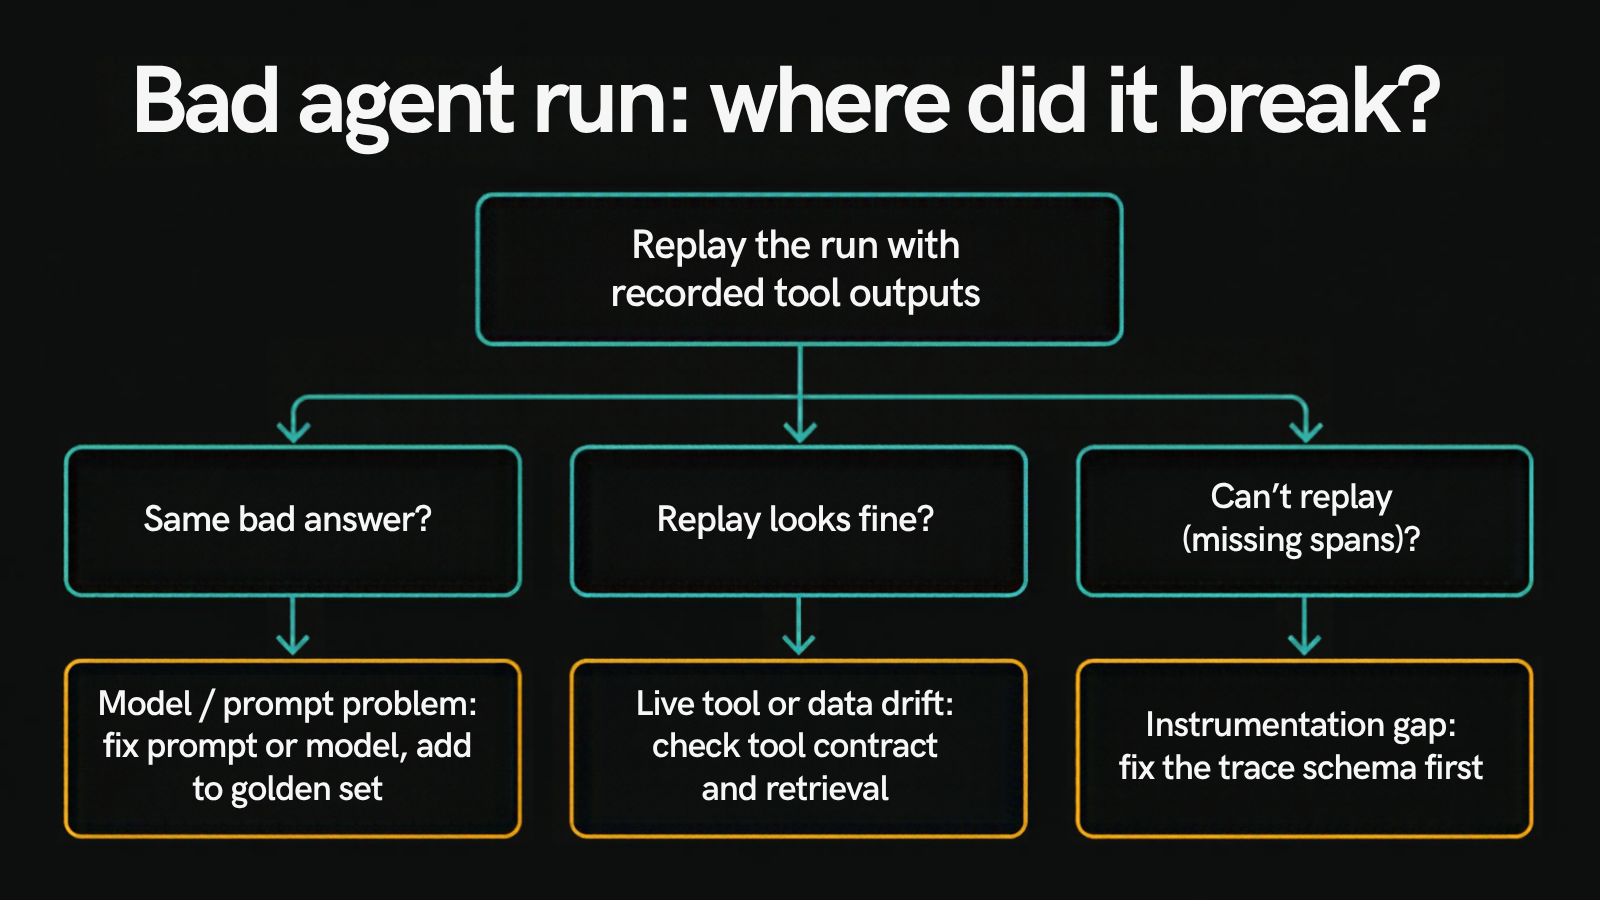
When a bad run comes in, I don't open the prompt file first. I open the trace and run it through this:
1. Can I replay it at all? If spans are missing, outputs were truncated, or the prompt version wasn't recorded, stop. The bug report is now an instrumentation bug. Fix the schema, then wait for the next occurrence. Guessing here costs more than waiting.
2. Replay with recorded tool outputs. Same bad answer? Then the world wasn't the problem — the model saw what it saw and decided badly. Fix the prompt, the model choice, or the decision structure, and promote this run into the golden set so the fix is tested on every build.
3. Replay looks fine? Then the original run saw something the replay doesn't reproduce, or the failure happened outside the model: a tool returned stale data, a retrieval index was mid-rebuild, a contract coerced an argument in a way nobody expected. Check the tool and retrieval spans against the live system's history. This is where most of my "the AI hallucinated" tickets actually end up.
Step 3 matters for honesty with clients. A lot of agent failures blamed on the model are data and integration failures. Without replay you can't tell the difference, so you rewrite prompts forever.
What I alert on vs what I just store
Traces are for debugging, not paging. I keep the alert surface small:
- Alert: spike in
unrecorded_calldivergences in nightly replay of sampled runs (a sign the agent's behavior shifted after a deploy); spans written without required fields; redaction failures (a sensitive field reaching the store unredacted is an incident, full stop). - Store and sample: every production run gets a trace; a small sample is replayed nightly in frozen mode as a smoke test that replay itself still works. If replay breaks silently, you find out during the incident, which is the worst time.
- Promote: every confirmed failure becomes a golden-set case within the same ticket. If a fix ships without a replayed test, I consider it unverified.
Retention is a policy decision, not an engineering default. I set it with whoever owns compliance on the client side, and redacted traces usually get a longer window than the raw vault.
Failure modes I keep seeing
Recording the final prompt only. The bug was in step two. You have step six.
Truncating tool outputs. "We only keep the first 2KB." The model saw 40KB. Replay is now fiction.
No prompt versioning. The template in the repo today is not the one that ran on Tuesday. Version templates like code and record the version on every span.
Tools hard-wired into the agent loop. You can't inject a stub, so you can't replay. Design for injectable tool and retrieval clients from the first commit.
Replay that can reach production. One unrecorded call falls through to the live API and your debugging session sends a customer email. No network route, not a config flag.
Redacting after write. Your backups have the raw data.
Treating the tracing vendor as the schema. Vendors are useful for the UI. The schema — what you record, how you hash args, how you version prompts — is yours. Keep it portable.
Never promoting failures. You debugged it, fixed it, and moved on. Three weeks later a refactor reintroduces it. The replayed run should have been a test.
Close
If the only record of a production agent run is a request log and a final completion, you don't have AI agent observability. You have a receipt.
Record every LLM call with its rendered messages, model, parameters, and prompt version. Record every tool and retrieval output in full, redacted before write. Record the planner's decisions. Build a replay harness that freezes the world, stubs every boundary, and has no route to production. Diff the replay against the original. Triage with the replay before you touch the prompt. Turn every confirmed failure into a golden-set case.
Contracts, shadow mode, eval gates, and budget caps make an agent safer to run. Replayable traces make it possible to fix. I don't ship a production agent without both.
I help teams instrument agents so bad runs become test cases instead of mysteries. If you're debugging a production agent with screenshots and prompt tweaks, hire me.
Building something with AI?
I help teams ship production AI agents, retrieval systems, and document intelligence. Let's talk about yours.